Checking Linux host performance (for the newbie)


Every time I interview someone (for a non-Unix admin position) and ask them how they would check for performance on Linux, I'd like to say that the only answer I always get is top. So this blog post is meant for everyone I've interviewed in my life and asked that question!
Here, I'll highlight a few other tools that you can use.
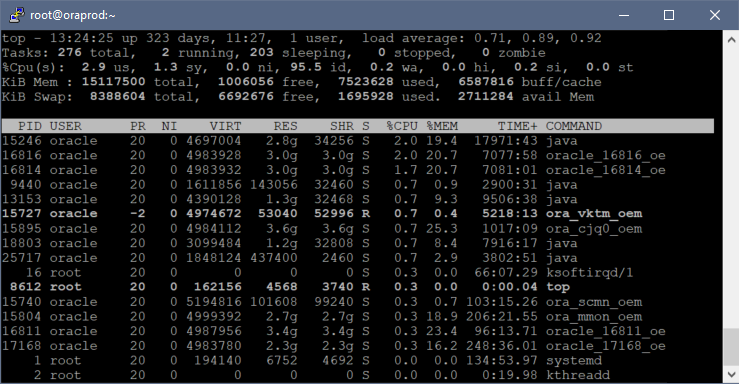
Top
The top command is popular because it provides a dynamic and real-time view of system performance.
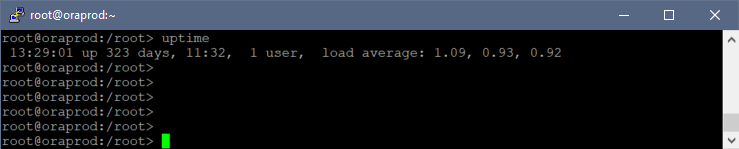
System Load
The uptime command provides some information such as system load averages. The last 3 numbers in the output are essentially the average number of processes that are in a runnable state; for the past 1 minute, 5 minutes, and 15 minutes respectively. If you're running a load test, you'll see these number creep up. If the system is cooling down or has reduced activity, the number will drop.
Don't use this value to different sets of servers, but rather use it to compare a single server at various points in time instead.
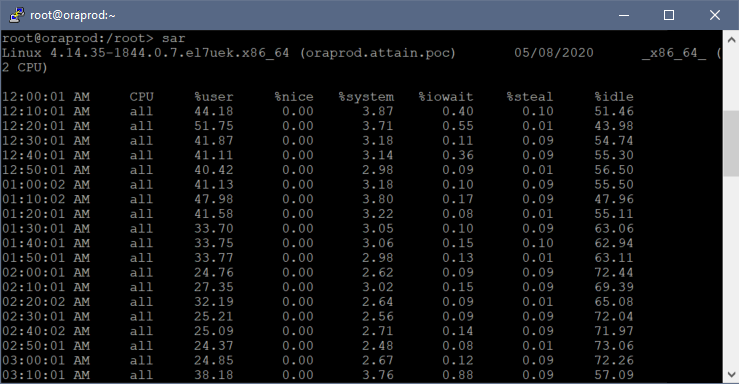
SAR (System Activity Report)
SAR stands for System Activity Report and the sar command reports on a slew of CPU, memory, and I/O metrics. Typing sar without any parameters will return the CPU utilization captured every 10 minutes, giving you a little more historical information. The documentation describes a lot more options.
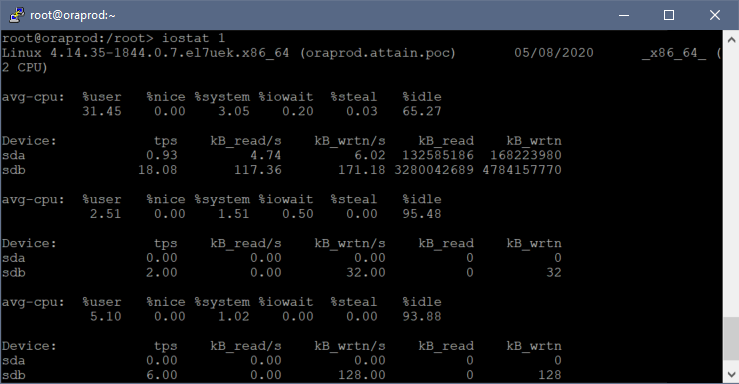
I/O Statistics
The iostat command (followed by a number, for number of seconds to refresh) provides I/O related metrics. Here you can see the kilobytes in and kilobytes out for every I/O device on your server, helping identify if there is extensive I/O activity or not.
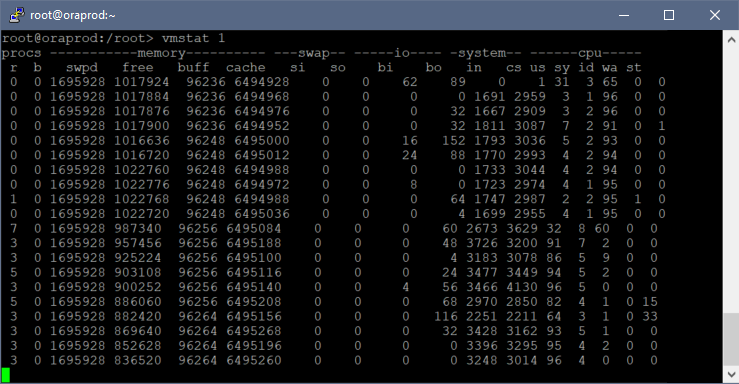
VM Statistics
The vmstat command is perhaps my favorite of all the commands on this post. Followed by a number X (e.g., vmstat 1), each row will be refreshed every X seconds.
You can observe the amount of SWAP memory used, free memory available, bytes in and out to the SWAP space, bytes in and out for I/O, as well as CPU utilization for user (us), system (sy), idle (id), and wait (wa).
Things I normally look out for:
- I ignore the free column. This supposedly reports how much memory is available, but the value is a little misleading (see this post to understand why).
- I look at the si and so columns (bytes in and out of SWAP). Typically if these values are greater than zero, that means that data is being written to SWAP (bad!). This is a clear sign that you've run out of memory.
- I look at bo and bi columns (I/O bytes in and out). If they are consistently high, then I know a lot of I/O activity is going on. This would not necessary indicate a problem, but rather just an observation and data point.
- Adding the values us, sy, and wa columns returned the total CPU used. Alternatively, I just look at the id column to identify how much of the CPU is idle.
- One of the most important data points here is the wa column. This means the processor is waiting on I/O, which is an extremely bad position to be in. Remember in the old days when you inserted a floppy disk in your desktop and the entire machine would freeze for 5 seconds until it could be read? That exemplifies what's happening here.