Database: It's Hard to Explain
When you are enough time in the business, you learn the universal rule of IT: "Computers don't make mistakes, people do." It is especially true for database performance tuning.


When you are enough time in the business, you learn the universal rule of IT: "Computers don't make mistakes, people do." It is especially true for database performance tuning.
Yes, the newest database optimizers are sophisticated (some of them even have building AI already) and they have numerous options to adopt and run your queries in the best possible way. To help computers win this battle, vendors have chosen the "dumb-down" path - stash away dangerous controls and show nice pictures to the "two-day-dba" folks and their managers. Something like the one below.
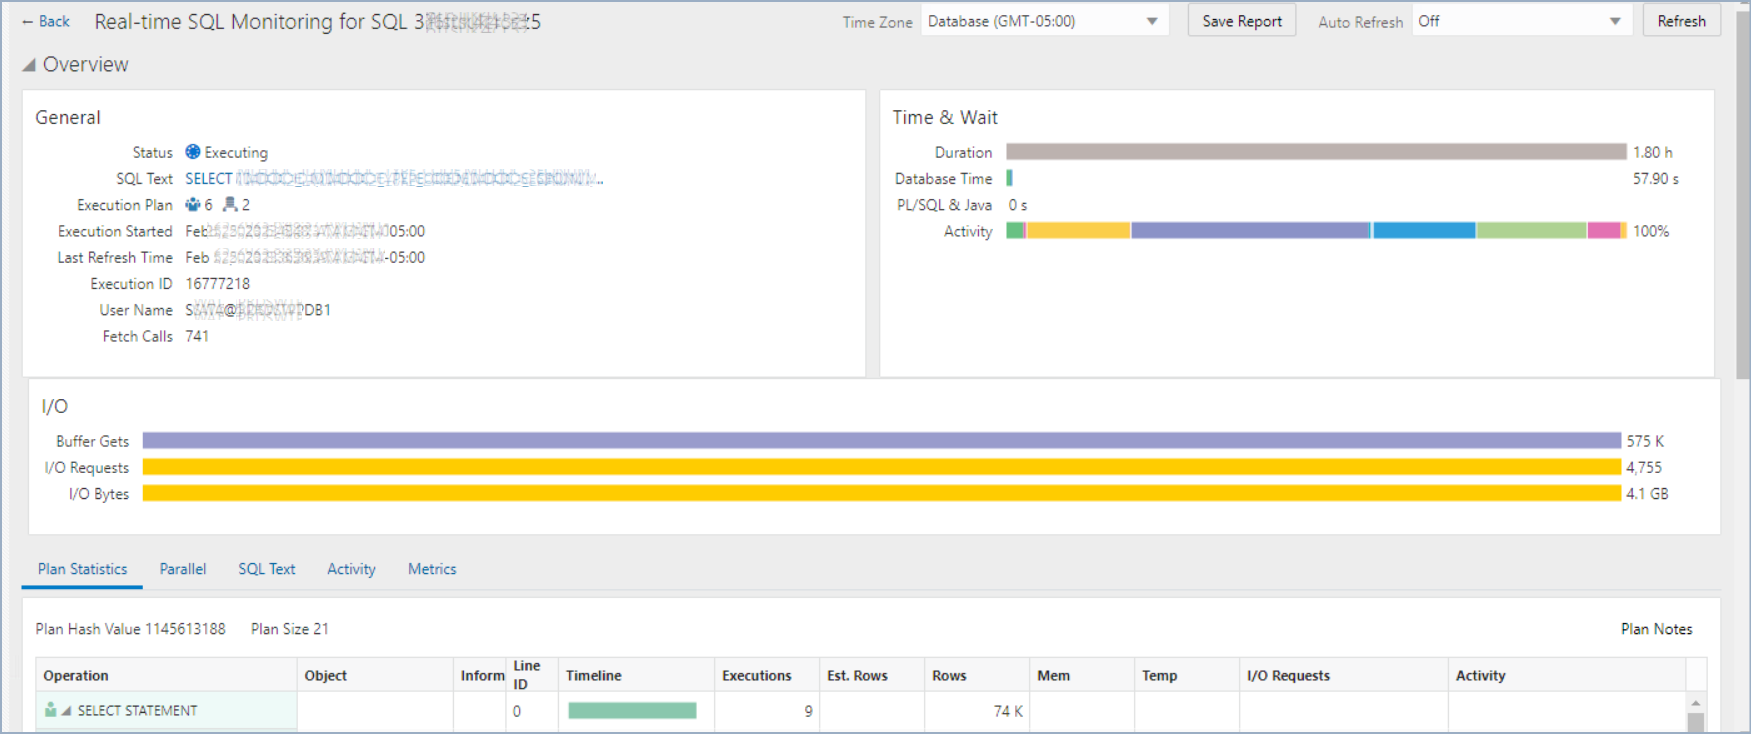
That is one of the latest (and probably the last one) OEM 13c consoles. On five pages it gives you fancy charts and good-looking execution plans but you hardly find why this particular plan has been chosen. If you really want to know - go through the Oracle Database performance tuning guide, or watch videos, or read blogs of the SQL Maria. Actually, that one leads to the great post about Oracle's build DBMS_XPLAN package.
Since all those nice charts and graphs build out from the same data you can have all those details and more right in the shell terminal. The query below does all that.
SELECT * FROM TABLE(
     DBMS_XPLAN.DISPLAY_CURSOR(
              sql_id=>'SOMESQL0ID',
              cursor_child_no=>0,
              format=>'ALLSTATS LAST')
);A few parameters to work with:
| Parameter | Explanation |
|---|---|
| sql_id | Hashed tag for the SQL text, you want to examine. You can grab it from SQL Monitoring Console, or find it using the V$SQL system view. Mandatory parameter |
| cursor_child_no | Sometimes Optimizer overloads cursors with adjusted values, so you may find the same SQLID but with different child numbers. The default value is 0 and most of the time you may not need it. But in some cases, the original plan is not available and you should provide the correct SQL child # to access the execution plan. |
| format | Prescribes the output format of the explanation. Almost every time, I run this query I put 'ALLSTATS LAST' which prescribes fetching all available execution statistics and printing it after the execution plan tree. |
I'll skip the SQL query and plan specifics and show you only the essentials:
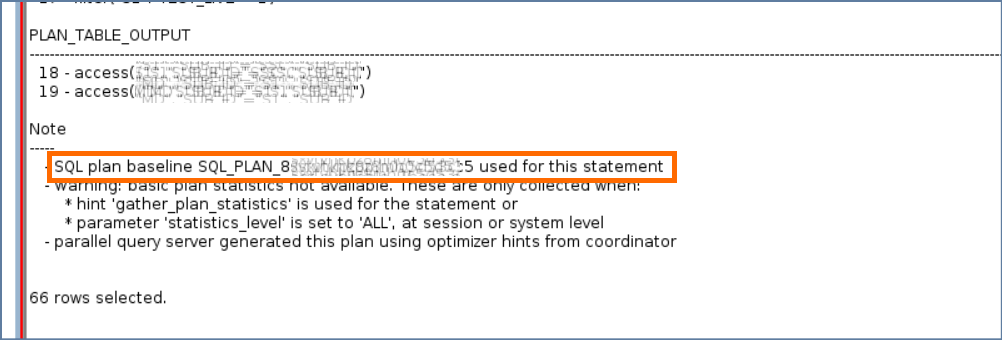
A single line in the note says that somewhere in the past execution plan for this query was pinned by the SPM's baseline.
In that particular case, it's still a good execution plan, but it may become a problem in the feature after yet another database upgrade.