Yet another custom OEM uptime report

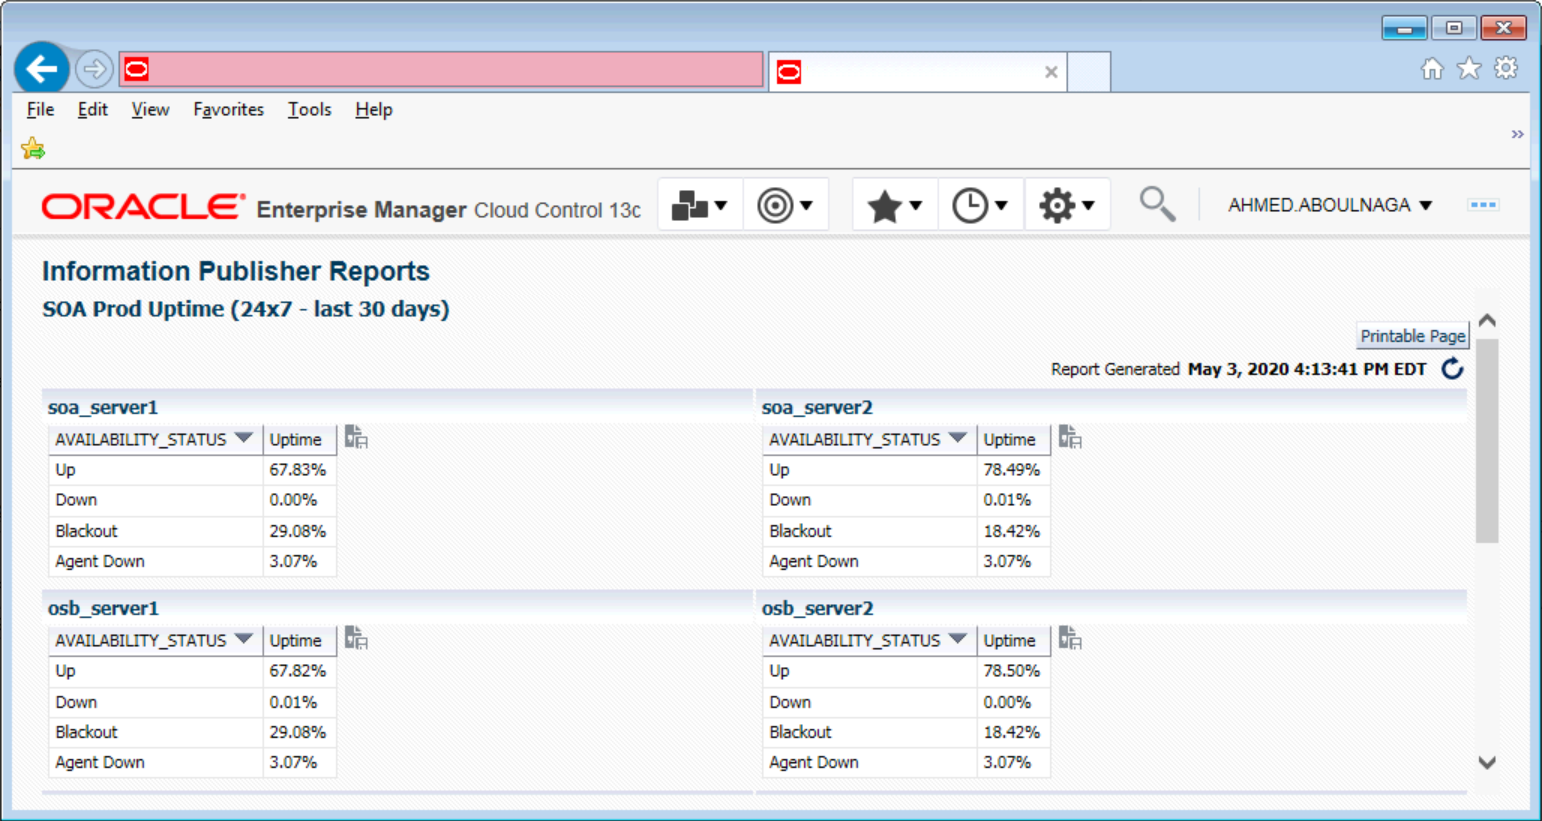
Here is my custom availability report in Oracle Enterprise Manager (OEM) 13c (using Information Publisher). It consists of multiple elements across multiple rows.
Though this report is specific to WebLogic Managed Servers, it could apply to any target type.
Each element is a distinct query:
SELECT
    a.availability_status                "Status",
    to_char(SUM(a.value), 990.99) || '%' "Uptime"
FROM
    (
        ( SELECT
            'Down' availability_status,
            0 value,
            2 order_col
        FROM
            dual
        UNION ALL
        SELECT
            'Up' availability_status,
            0 value,
            1 order_col_txt_id
        FROM
            dual
        UNION ALL
        SELECT
            'System Error' availability_status,
            0 value,
            5 order_col_txt_id
        FROM
            dual
        UNION ALL
        SELECT
            'Agent Down' availability_status,
            0 value,
            4 order_col_txt_id
        FROM
            dual
        UNION ALL
        SELECT
            'Blackout' availability_status,
            0 value,
            3 order_col_txt_id
        FROM
            dual
        UNION ALL
        SELECT
            'Status Pending' availability_status,
            0 value,
            6 order_col_txt_id
        FROM
            dual
        )
        UNION ALL
        SELECT
            decode(lower(availability_status),
                'target down',     'Down',
                'target up',       'Up',
                'metric error',    'System Error',
                'agent down',      'Agent Down',
                'unreachable',     'Unreachable',
                'blackout',        'Blackout',
                'pending/unknown', 'Status Pending') availability_status_txt_id,
            round(SUM(least(nvl(end_timestamp, sysdate), sysdate) -
            greatest(start_timestamp, sysdate - 30)) * 100 / 30, 2)
            AS value_txt_id,
            decode(lower(availability_status),
                'target down',     2,
                'target up',       1,
                'metric error',    5,
                'agent down',      4,
                'unreachable',     7,
                'blackout',        3,
                'pending/unknown', 6) order_col_txt_id
        FROM
            sysman.mgmt$availability_history b,
            sysman.mgmt$target               t
        WHERE
            b.target_guid = t.target_guid
            -- ----------------------------------------
            -- Hardcoded target information
            -- ----------------------------------------
            AND b.target_name = '/prod_soa_domain/soa_domain/soa_server1'
            AND lower(availability_status) != 'unreachable'
            -- ----------------------------------------
            -- Hardcoded timeframe
            -- ----------------------------------------
            AND ( ( b.end_timestamp >= sysdate - 30 ) OR b.end_timestamp IS NULL )
            AND b.start_timestamp <= sysdate
        GROUP BY
            lower(availability_status),
            decode(lower(availability_status),
                'target down',     2,
                'target up',       1,
                'metric error',    5,
                'agent down',      4,
                'unreachable',     7,
                'blackout',        3,
                'pending/unknown', 6)) a
WHERE
    lower(availability_status)     != 'status pending'
    AND lower(availability_status) != 'system error'
GROUP BY
    a.availability_status,
    a.order_col
ORDER BY
    a.order_col
Observe the comments in the query above, and tailor it to your specific needs.
These metrics are returned from the MGMT$AVAILABILITY_HISTORY and MGMT$TARGET views.