Monitoring AWS EC2 Instances on Amazon Linux AMI with CloudWatch [2024]
![Monitoring AWS EC2 Instances on Amazon Linux AMI with CloudWatch [2024]](/content/images/size/w2000/2024/06/DALL-E-2024-05-31-23.50.45---A-visually-appealing-image-for-a-blog-post-about-monitoring-AWS-EC2-instances-on-Windows-Server-with-Amazon-CloudWatch.-The-image-should-feature-eleme.webp)
While performance and cost-efficiency are essential for AWS, effectively monitoring AWS EC2 instances is the key to staying above both factors. In this blog post, I will guide you through installing and configuring Amazon CloudWatch Agent on an EC2 Linux instance, enabling you to monitor key metrics and set up alerts.
What is Amazon CloudWatch? It's a managed service that collects and tracks metrics, monitors log files, and sets alarms through Agents deployed to your EC2 instances (the Agent can also be deployed on on-prem systems as well). It helps gain system-wide visibility into resource utilization, application performance, and operational health.
Prerequisites
What are Amazon CloudWatch Prerequisites? To be able to use Amazon CloudWatch, you will have to confirm that the following is available:
- AWS account with necessary permissions.
- IAM role with CloudWatch permissions is attached to the instance.
Creating an IAM Role for CloudWatch
- Go to the IAM console.
- Click on "Roles" and then "Create role".
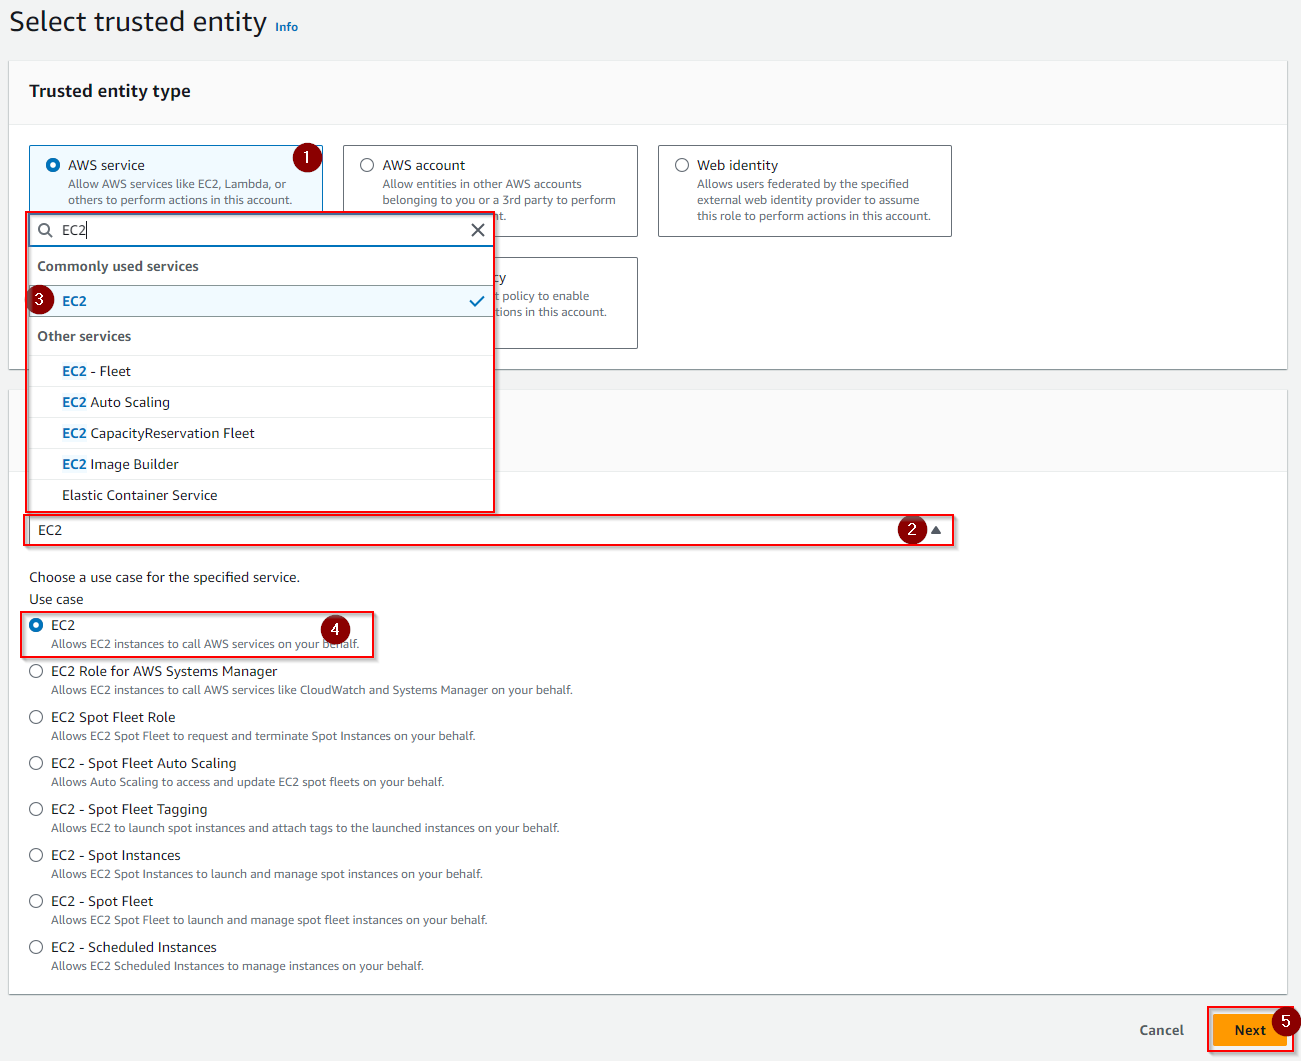
- At the "Select trusted entity" section, choose "AWS service" as in step marked "1" below.

- Choose "EC2" as the service that will use the role from the drop menu as shown in marked 2 and 3 above. Then select "EC2" from the "Use case" options as marked in 4, then hit "Next".
- At the "Permissions policies", attach "AmazonEC2RoleforSSM" and "CloudWatchAgentServerPolicy".
- Note: Since "AmazonEC2RoleforSSM" will soon be deprecated. you may use "AmazonSSMManagedInstanceCore" policy to enable AWS Systems Manager service core functionality on EC2 instances.
- Name the role (e.g., CloudWatchAgentRole) and create it.
- Attach this role to your EC2 instance.
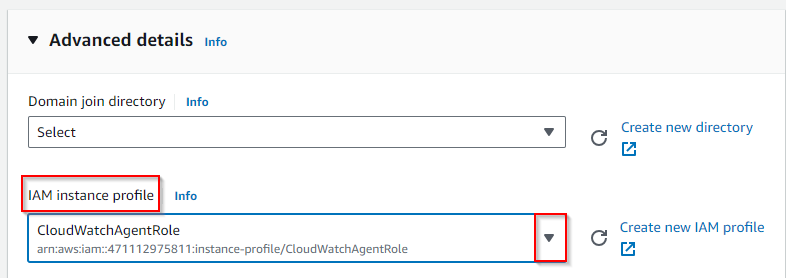
- Before we can go ahead and Install the CloudWatch Agent on EC2 Amazon Linux 2023 AMI, make sure you select "CloudWatchAgentRole" from the "IAM instance profile" menu in the "Advanced details" section as in the picture below:

At the bottom of the configuration page, insert the following bash script in the User data bash box, which will push the yum updating on the EC2 instance:
#!/bin/bash
yum update -y
Installing the Agent on Linux
- Log in to your EC2 instance and run the following command:
sudo yum install amazon-cloudwatch-agent -y
- Wait until you receive the confirmation below:

- Running and configuring the Agent: To run the agent configuration manager, use the following command:
sudo /opt/aws/amazon-cloudwatch-agent/bin/amazon-cloudwatch-agent-config-wizard- As this is a Linux-based EC2, we will select "Linux".
- Next, we will select "EC2" since this is the type of instance we just built.
- Next, Select the User you plan to run the agent with. I'll choose an Admin or Root user here.
- Turn on StatsD Daemon. This feature is essential for collecting all the activity and event data and fetching it in CloudWatch.
- Next, select the default port [8125], your interval collection period based on your preferences, and aggregation intervals for metrics collected by the StatsD daemon.
- Important: Select No for the question: Do you want to monitor metrics from CollectD? Since we didn't install CollectD on the agent, if we select the default "Yes," the agent will fail to start.
- The rest is configured based on your preferences as intervals go directly with the cost.
At the end, it will summarize the configuration for you, and will ask you to confirm, then we will hit "Yes" as all those options could be reconfigured manually after the wizard completes.
The rest of the questions will be related to log name, location, group class, retention in days, collecting X-ray traces, and whether you want to store the config in the SSM Parameter store.
Verifying the Agent Installation
Then, to confirm the configuration file has been created successfully, type the following commands consequently:
cd /opt/aws/amazon-cloudwatch-agent/bin/lsConfirm that "config.json" has been created in the listed files before you move next.
Starting the Agent on Linux
To start the "CloudWatch" agent, run the following command line:
sudo /opt/aws/amazon-cloudwatch-agent/bin/amazon-cloudwatch-agent-ctl -a fetch-config -m ec2 -s -c file:/opt/aws/amazon-cloudwatch-agent/bin/config.jsonTesting the CloudWatch Agent
- After the agent has started, we can perform some load tests on the EC2 to see if our agent can catch and report that load. We may run the following prompt which will install install PostgreSQL on the EC2.
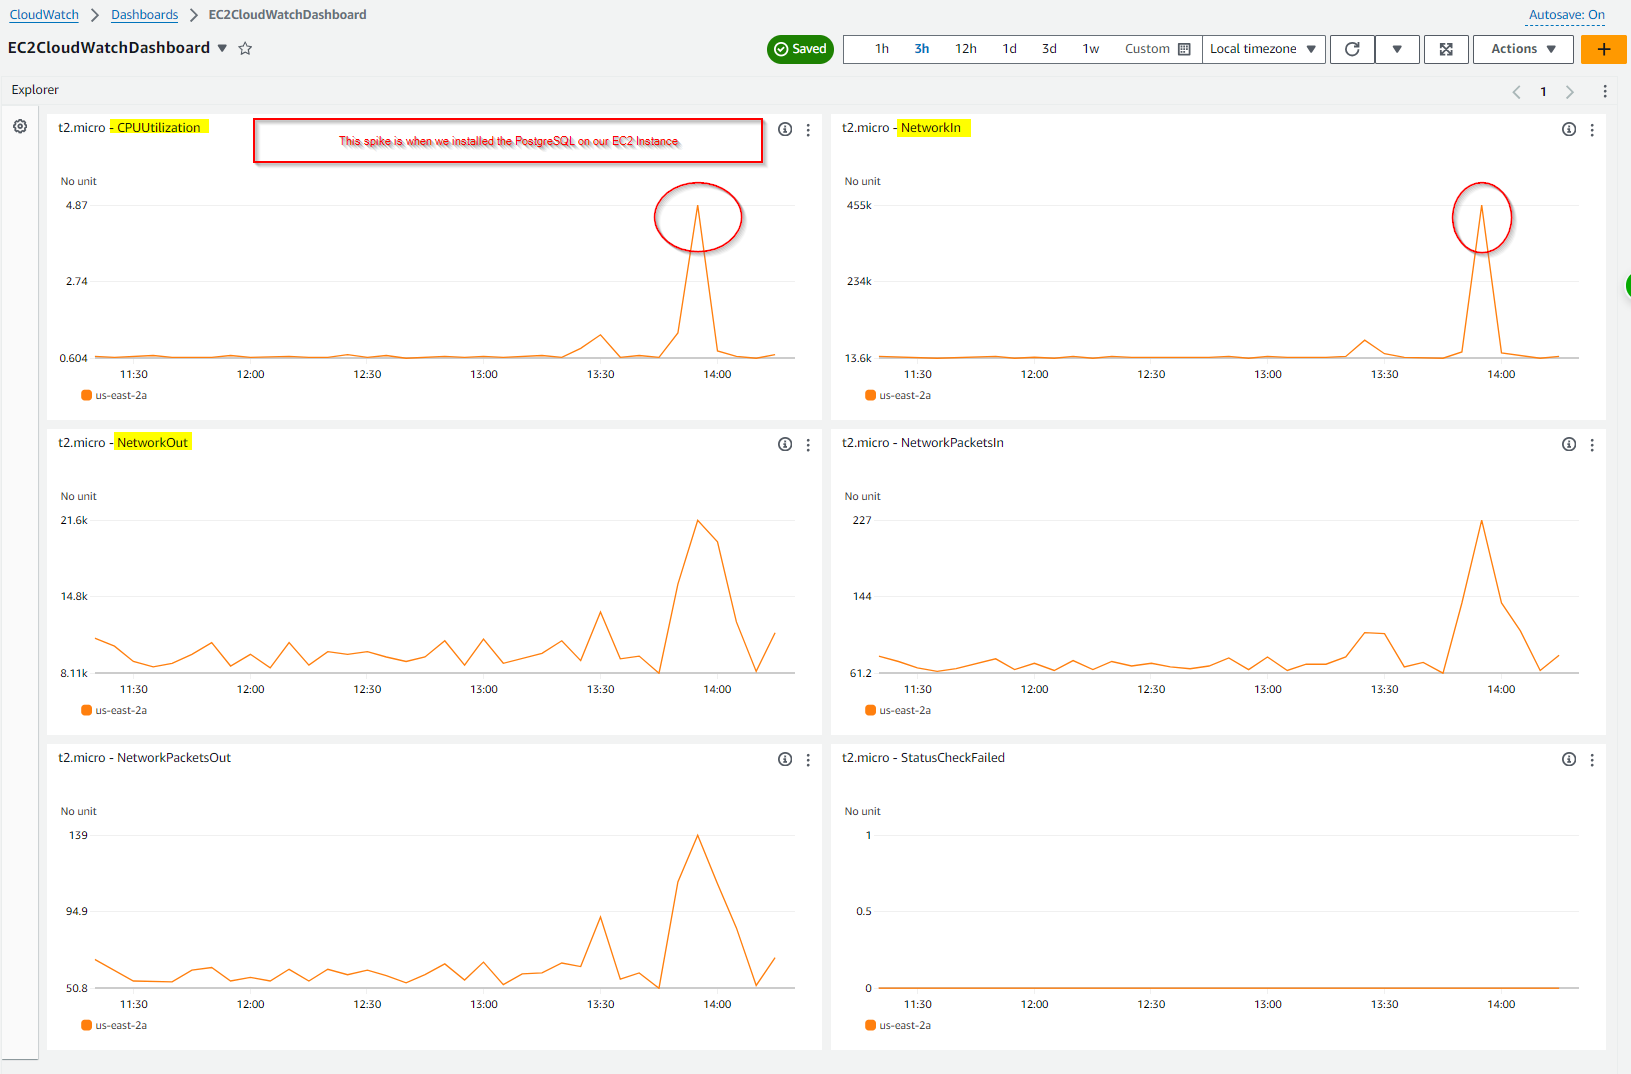
sudo dnf install postgresql15- Monitoring Dashboard: Navigate to the AWS Management Console, "CloudWatch" > Dashboard, and build your customized dashboard. As noted in the example below, we have the CPU utilization spike following our load test as done in our last step:

Final Thoughts
Following the steps outlined in this blog post, you can effectively monitor your AWS EC2 instances on Amazon EC2 Linux Server using CloudWatch. This ensures you maintain optimal performance and cost-efficiency while gaining valuable insights into your infrastructure.
Happy CloudWatch-ing!

