Create a custom metric extension in OEM 13c


Oracle Enterprise Manager (OEM) 13c is a solid and comprehensive monitoring tool, providing a long list of monitoring metrics across a large number of target types. But there are bound to be certain custom checks you'd like to perform that are not natively provided by the product.
To address this, OEM provides the ability to create what are known as metric extensions to help address this.
In this blog post, I walk through a simple example of creating a shell script that performs a basic NFS check and integrating it into OEM.
Create a Custom Shell Script
I've created a couple of shell scripts that simply test if our NFS mount point is available and responding in a timely manner.
Create a script check_nfs_availability.sh:
#--------------------------------------------------
# Check availability and performance of NFS
#--------------------------------------------------
# Logic:
#   1. Create a TestFile0 with size 10 MB on local storage
#   2. Move the file to NFS as TestFile1
#   3. Move the file from NFS back to local storage as TestFile2
#   4. If the file copy takes longer than 2 seconds, return "NFS FAIL"
#   5. If the final TestFile2 is not exactly 10 MB in size, return "NFS FAIL"
#   6. Otherwise, all is good and return "NFS SUCCESS"
#   7. Output should be a single line, to be parsed by OEM 13c Metric Extension
#   * Make sure to use fully qualified paths in the scripts
#--------------------------------------------------

#--------------------------------------------------
# Parameters
#--------------------------------------------------
SLEEP_TIME=2
TEST_FILE_SIZE=10240
LOCAL_FOLDER=/tmp
NFS_FOLDER=/share

#--------------------------------------------------
# Create TestFile1 with a file size of TEST_FILE_SIZE
#--------------------------------------------------
rm -f ${LOCAL_FOLDER}/test_file_0.txt
dd if=/dev/zero of=${LOCAL_FOLDER}/test_file_0.txt count=1024 bs=${TEST_FILE_SIZE} > /dev/null 2>&1

#--------------------------------------------------
# Call script to copy file from local disk to NFS and back in the background
#--------------------------------------------------
nohup /home/oracle/scripts/check_nfs_availability_2.sh > /dev/null 2>&1

#--------------------------------------------------
# Wait for a maximum of SLEEP_TIME seconds
#--------------------------------------------------
sleep ${SLEEP_TIME}

#--------------------------------------------------
# Check if file made it back in time and the right size
#--------------------------------------------------
VFILE=${LOCAL_FOLDER}/test_file_2.txt
if [[ -e "${VFILE}" ]]; then
  # Error means that file that is copied back from NFS is not the expected 10MB in size
  VSIZE=`du ${LOCAL_FOLDER}/test_file_2.txt | awk '{print $1}'`
  if [ ${VSIZE} -eq 10240 ]; then
    echo "NFS SUCCESS"
  else
    echo "NFS FAIL"
  fi
else
  # Error means that file is not copied back from NFS in under 2 seconds
  echo "NFS FAIL"
fi

#--------------------------------------------------
# Remove any temporary files
#--------------------------------------------------
rm -f ${LOCAL_FOLDER}/test_file_0.txt > /dev/null 2>&1
rm -f ${NFS_FOLDER}/test_file_1.txt   > /dev/null 2>&1
rm -f ${LOCAL_FOLDER}/test_file_2.txt > /dev/null 2>&1
Create a script check_nfs_availability_2.sh:
#--------------------------------------------------
# Parameters
#--------------------------------------------------
LOCAL_FOLDER=/tmp
NFS_FOLDER=/share

mv ${LOCAL_FOLDER}/test_file_0.txt ${NFS_FOLDER}/test_file_1.txt
mv ${NFS_FOLDER}/test_file_1.txt ${LOCAL_FOLDER}/test_file_2.txt
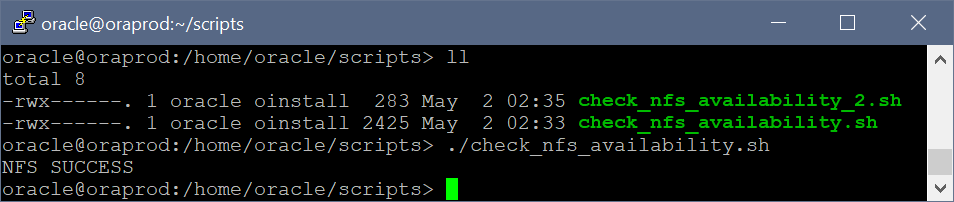
Here's a sample execution of the script. The output is either "NFS SUCCESS" or "NFS FAIL".
Create an OEM Metric Extension
1. Log in to the OEM 13c console.
2. Navigate to Enterprise > Monitoring > Metric Extensions.
3. Click on Create > Metric Extension.
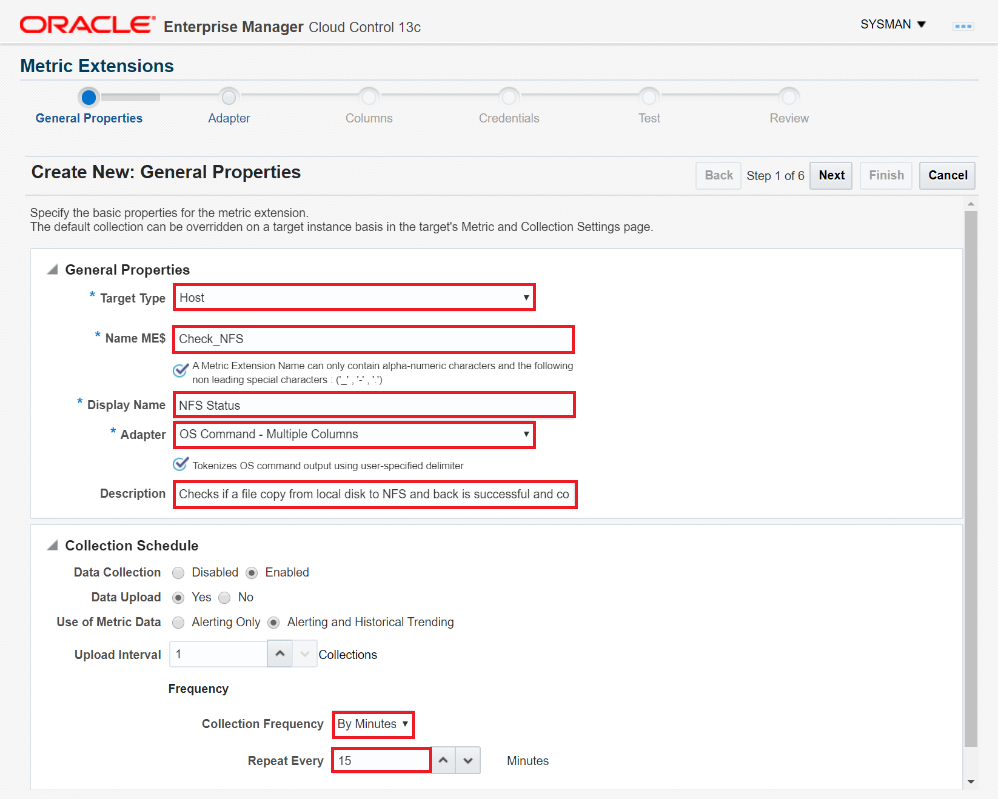
4. In this case, the Target Type we are referencing is of type "Host". Provide a name for the metric extension, a display name, and choose "OS Command - Multiple Columns".
5. Keep the Collection Schedule as is (so that historical metrics are collected), but update the collection frequency as you see fit.
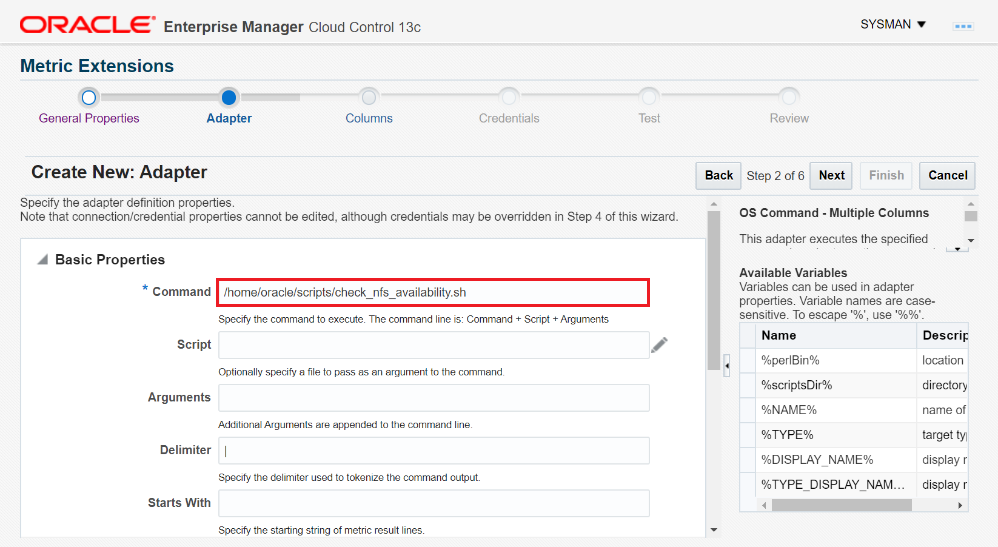
6. Enter the full path to the script. Don't worry about which host it will run on just yet.
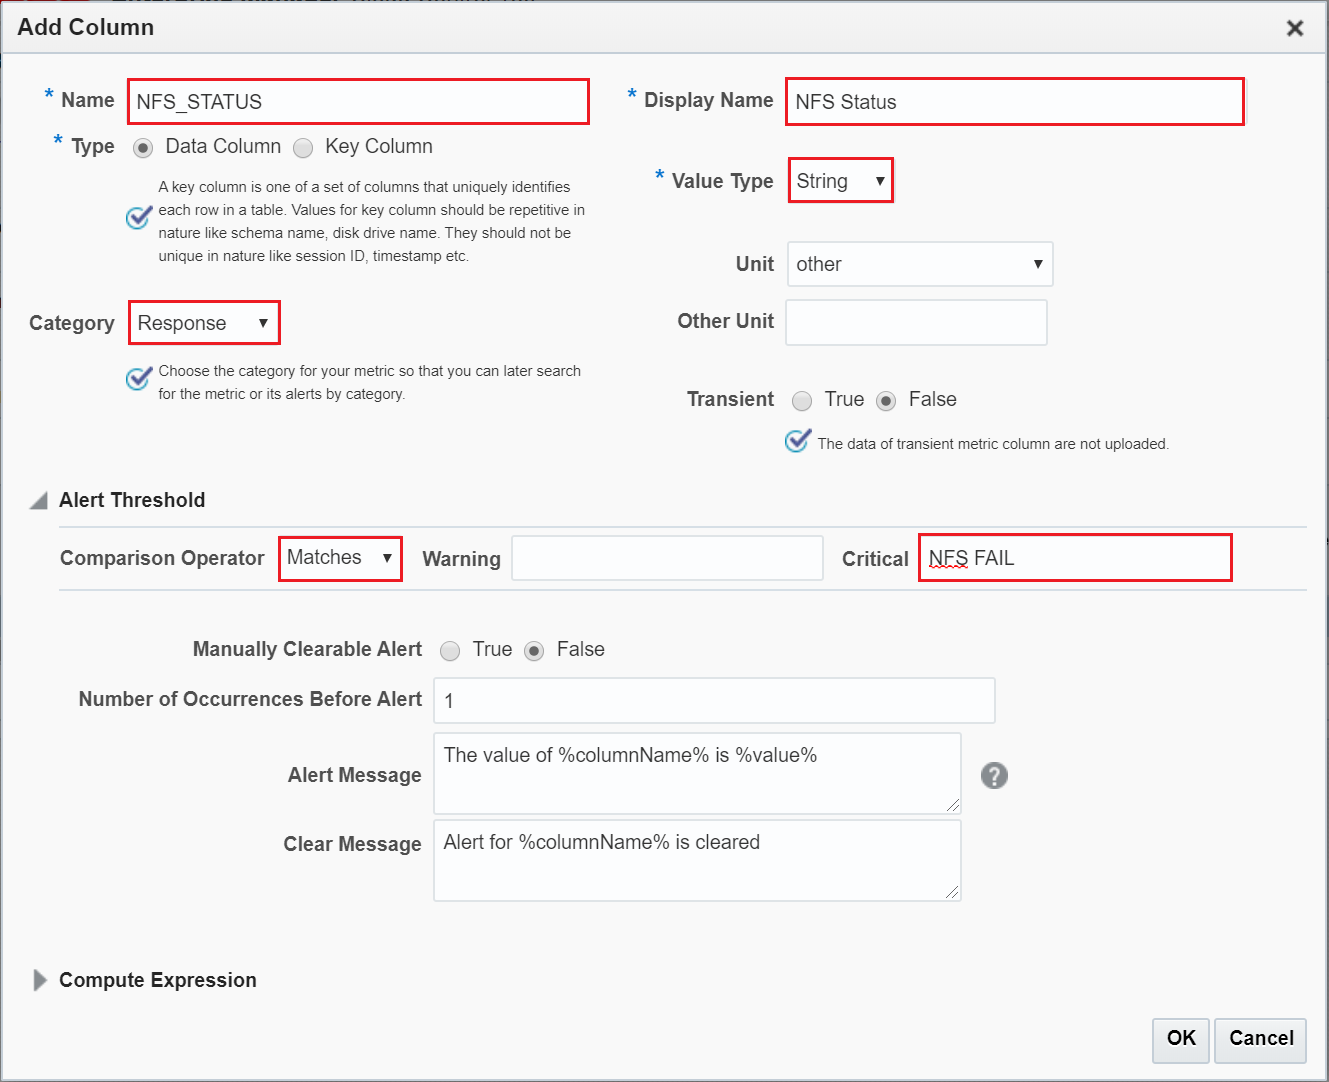
7. In the Create New: Columns page, click on Add > New metric column.
8. Provide a column name, and fill out the relevant information. Add the alert threshold. This will determine the condition on which a Warning or Critical alert will be sent.
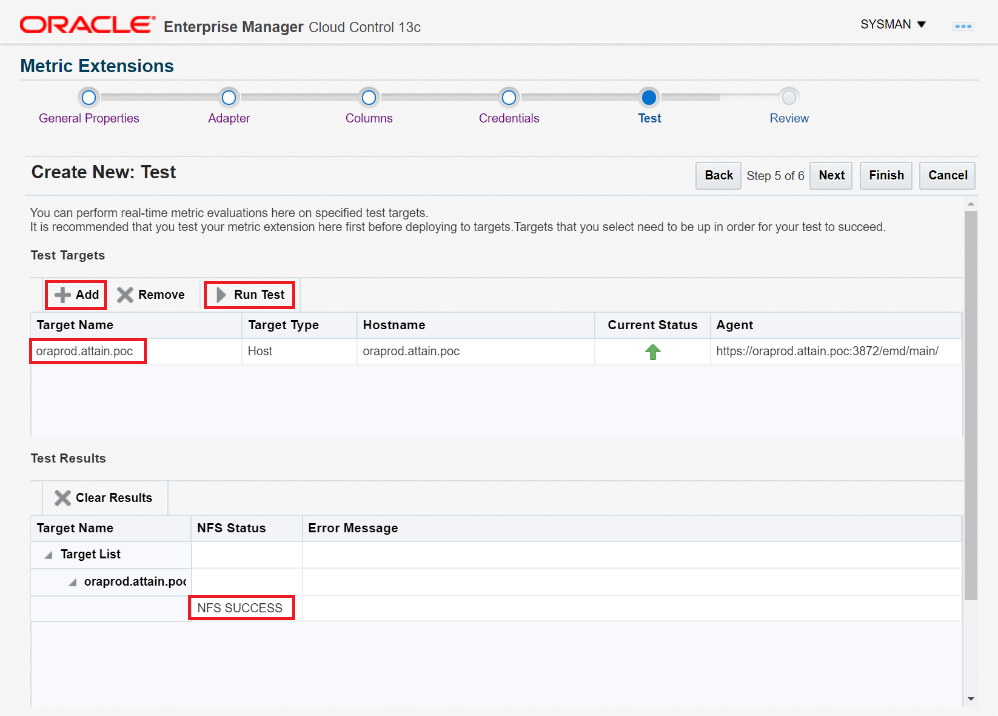
9. On the Create New: Test page, this is where we test the script. After selecting a target, click on Run Test.
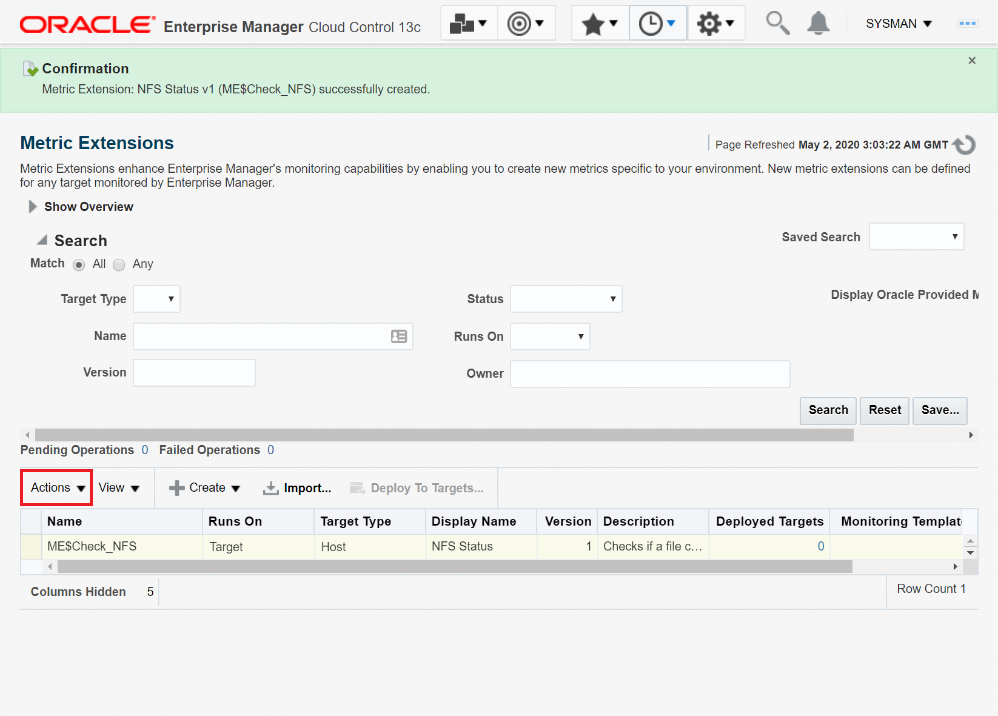
10. The metric extension is now created and you will be redirected to the Metric Extensions page.
Deploy the Metric Extension
11. Select the newly metric extension, then click on Actions > Save as Deployable Draft.
12. The metric extension is now deployed.
Deploy the Metric Extension to a Target
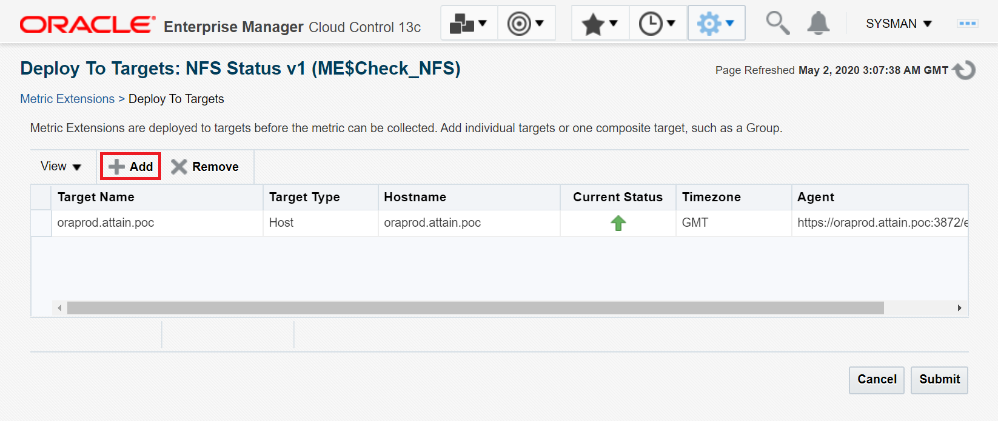
13. Then select the metric extension again, but this time click on Actions > Deploy to Targets.
14. Select any number of targets. Remember to make sure that the scripts you intend on running exists on the hosts.
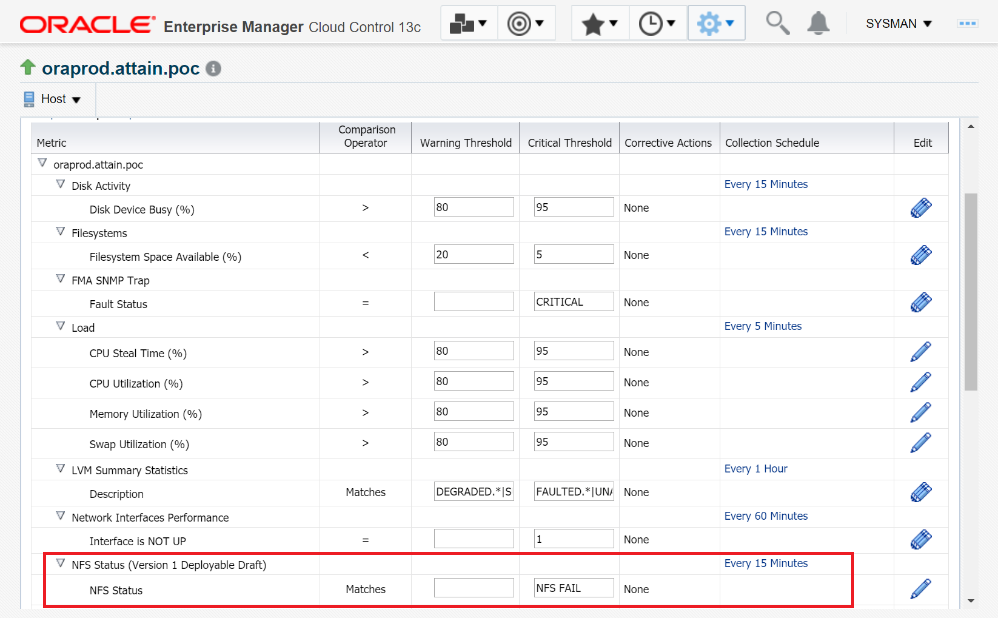
View and Customize the Alert Thresholds
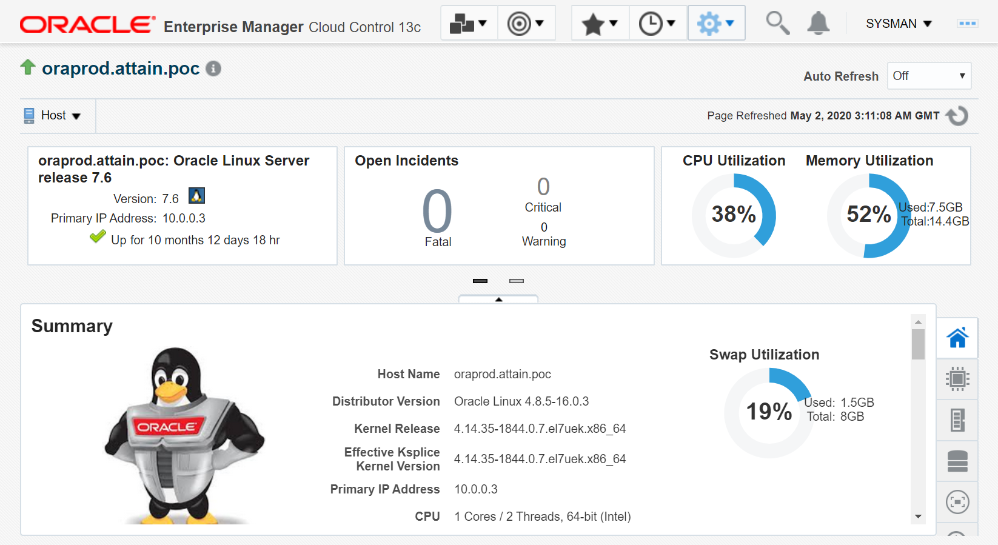
15. Now navigate to the target that we just deployed metric extension to, in this case, the target type was a particular host.
16. Click on Host > Monitoring > Metric and Collection Settings.
17. You will now find our newly created metric extension!
This is one way to easily create shell script based custom extensions.
You can also create scripts that return a delimited output (must be on a single line though).